
Why We Fix the Problem, Not the Alert: Root Cause Resolution
Infrastructure Telemetry • Alert Fatigue Remediation
Strategic Summary: Shifting to an enterprise-grade tracking platform can surface hundreds of unresolved, background configuration alerts across a multi-tenant corporate network. While the easiest operational response is to suppress these notifications, Si Futures executed a comprehensive root-cause cleanup. Resolving anomalies at the source protects network performance and converts your central dashboard into a trusted source of real-time operational health data.
Zabbix’s detailed templates interrogated interfaces, services, and software health parameters across all endpoints. This detailed look triggered an immediate wave of 260 to 320 background alerts across our client environments. The sudden influx didn’t mean system failures had occurred; instead, it exposed a long backlog of minor, unresolved bugs that had been sitting quietly in the background without proper tracking monitors.
The Dangerous Pattern of Alert Suppression
The most common response to an overloaded administrative panel is simple notification suppression. Overworked IT teams frequently place devices into permanent maintenance windows, change sensor parameters, or disable warning codes to clear their desks for immediate tasks.
While this clean-up strategy appears efficient in the short term, it introduces serious long-term operational risks. As corporate operations scale, legacy permissions are forgotten, and unmonitored devices drift outside corporate standards. Suppressing indicators means that when critical drops occur, internal desks remain completely blind because the alerting system was quietly disabled years prior for reasons no one can trace.
Root Cause Isolation: Engineering Actions over Interface Masking
Our engineering team systematically worked through the entire alert database to fix bugs directly on the production hardware rather than adjusting software filters:
- Router Fleet Realignment: Engineers audited over 90 MikroTik core routing devices to manually correct missing Engine ID parameters.
- Perimeter Port Closures: Active but unassigned firewall ports were systematically disabled, ensuring a solid managed cyber security profile and enforcing compliance frameworks across local business facilities.
- Telemetry Protocol Upgrades: Basic ping checks were replaced with descriptive SNMP tracking, while legacy SNMP v2 links were shifted onto encrypted SNMP v3 tunnels to maximize security.
- Filter Refinement: Legitimate baseline variables—such as user disconnect alerts on virtual interfaces—were separated out, keeping tracking metrics focused purely on high-value fiber backbones.
Establishing an Actionable Operational Monitoring Baseline
Following a coordinated team push, active cross-tenant notifications dropped from over 300 down to six genuine, isolated issues under active vendor investigation. Out of more than 2,000 tracked metrics, only a fraction required direct hardware intervention. This low failure rate validates our standardized deployment builds while cleaning up the minor technical overhead that accumulates over time.
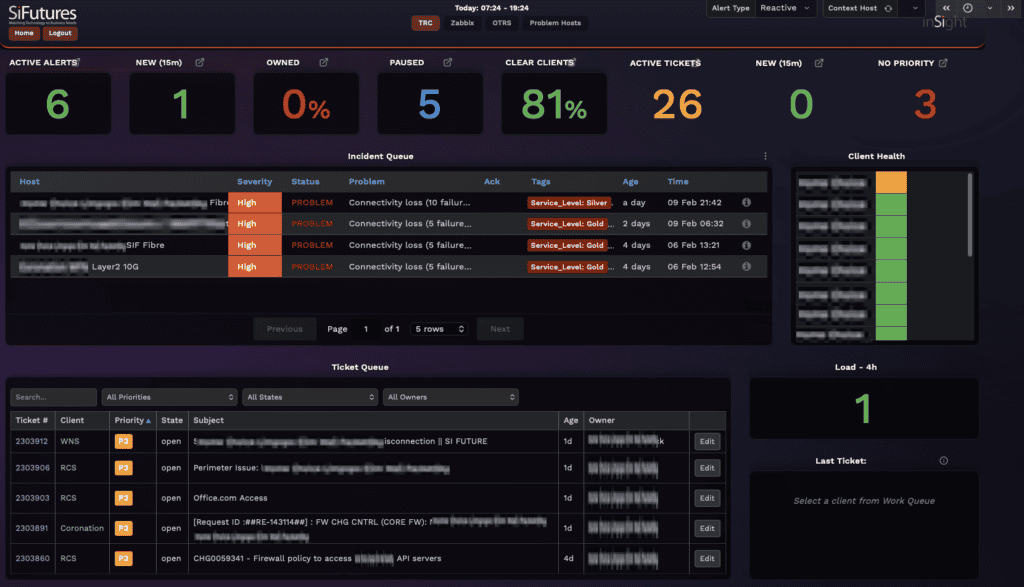
This cleanup completely changes how our central support desk interacts with network events. Clearing out background noise ensures that any live dashboard alert indicates a real operational threat requiring immediate attention. Committing to this root-cause methodology means corporate leadership can make confident, data-driven decisions based on live infrastructure telemetry.
“When every alert on the dashboard represents a genuine issue rather than accumulated noise, monitoring becomes what it was always meant to be: an honest view of operational health that drives real decisions.”
Our core philosophy centers on maintaining real visibility over the health of your digital ecosystem. Isolating root causes rather than masking system symptoms is a core pillar of how our threat detection and response pipelines secure business continuity.
Strategic network oversight means ensuring every dashboard event represents an authentic risk that demands engineering action.
